- Blog
Ultrasonic Corrosion Mapping of Pipelines

What is Pipeline Corrosion and Erosion?
Pipelines are critical infrastructure assets. However, corrosion poses significant risks to their integrity. Ultrasonic testing (UT), particularly phased array ultrasonic testing (PAUT), is pivotal for corrosion mapping.
In this blog, we aim to educate on pipeline corrosion mapping using conventional UT and phased array ultrasonic testing, a non-destructive technique, penetrates pipeline material with high-frequency sound waves, revealing internal conditions. PAUT enhances this with superior resolution and scanning capabilities.
Conventional UT uses single-element transducers to detect corrosion, but manual scan plans limit the overall view of any corrosion detected. PAUT overcomes these limitations. Efficient inspection strategies and accurate data interpretation remain challenges in pipeline corrosion mapping. Smart ultrasound scan plans integrate advanced instrument technology and probes and optimize inspection routes and parameters in real-time. UT and PAUT, with Sonatest technology, offer reliable pipeline inspection solutions. Smart scan plans drive innovation, ensuring the safety and longevity of critical infrastructure.

Fig. 1 - Pipeline Example
Pipeline Integrity using Ultrasonic Methods
Current Standard Corrosion Mapping Methods:
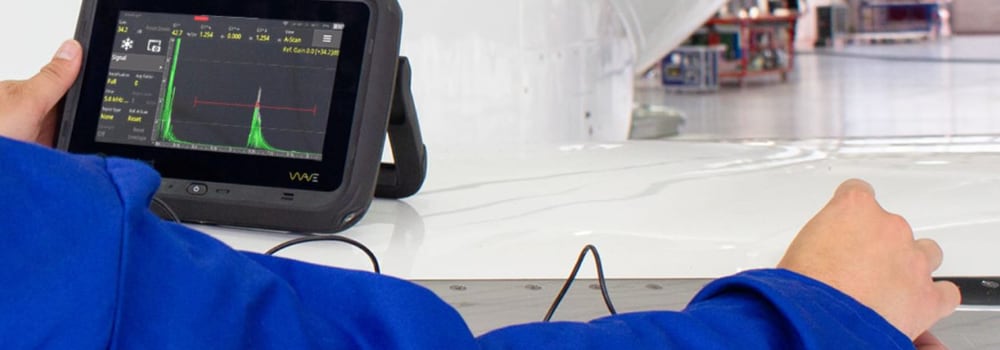
Standard corrosion mapping methods often involve ultrasonic thickness measurements with grid layouts, typically conducted using equipment like the Sonatest Wave. This approach entails systematically inspecting the surface of the pipeline with a UT probe to measure the thickness of the pipe wall at various points. These measurements are then plotted on a grid to create a map of corrosion levels across the pipeline. UT inspections requires an open and clean OD pipe, no insulation but external coating is allowed.
Additional inner cladding and rubber lining can be extra challenging, so we recommend contacting our applications team if you need to solve your unique situation.

Fig. 2 - Inspection Grid Layout on Pipe
The T-Log feature on the Sonatest Wave is a notable advancement in UT thickness mapping. It enables inspectors to set up and create custom grids and thresholds effortlessly, streamlining the data collection process. Inspectors can add measurements to grids smoothly and simply, automatically generating color-coded grids that can be exported to Excel formats or reports. Additionally, T-Log provides inspection statistics such as minimum, maximum, and average thickness, improving data interpretation and reporting capabilities.

Fig. 3 - T-Log Grid Layout on Wave
See our T-Log for Thickness Surveys on The Wave and DFDs (pdf, 2.6mb) solution note for more information.
Challenges and Downsides of UT Thickness Mapping:
Despite being a widely used method, UT thickness mapping with grid layouts presents several challenges and downsides:
- Extensive Man Hours - The process of manually scanning the entire surface of the pipeline, grid point by grid point, can be labor-intensive and time-consuming, requiring significant manpower
- Datalogging Issues - Recording and managing the vast amount of data collected during the inspection process can be cumbersome and prone to errors, especially with manual data entry
- Low Coverage Area - Grid layouts may not cover the entire surface area of the pipeline efficiently, leading to potential gaps in inspection coverage and overlooking critical areas
Introduction of Phased Array:
Phased Array Ultrasonic Testing (PAUT) offers a revolutionary alternative to traditional UT thickness mapping methods. With PAUT, multiple ultrasonic elements within the probe can be electronically controlled to raster through groups of smaller elements across a wide plane, acquiring multiple measurements over a large area. This capability increases coverage area and resolution simultaneously, enhancing the precision and efficiency of inspection. PAUT, often used with advanced equipment like the Veo3, brings several advantages over standard UT thickness mapping methods.
Advantages of PAUT:
- Increased Coverage Area - PAUT can cover larger areas of the pipeline in a single scan, reducing inspection time and improving efficiency
- Faster Inspection Times - The dynamic control of sound beams in PAUT enables faster inspection speeds compared to manual scanning methods, resulting in quicker turnaround times for inspections
- Higher Sensitivity and Resolution - PAUT offers superior sensitivity and resolution, making it capable of detecting smaller defects such as pitting corrosion with greater accuracy
- Better irrigation and crawler integration - There are interesting PA probes with integrated water ports so it is easy to deploy a pumping system that allows for a more efficient coupling quality. There are also many scanner suppliers specific to PA probes, that allows for a better scanning experience and straight lines for a better C-scan representation

Fig. 4 - Corrosion Map using Phased Array UT
See our Manual Phased Array Corrosion Mapping (pdf, 1.9mb) application note for more information.
Adding the Convenience of the WheelProbe:
The WP2 WheelProbe, designed for use with the Veo3, offers a seamless solution for inspecting pipelines. This innovative probe can smoothly roll around the pipe surface, using a small amount of water as a coupling agent. The ergonomic design of the WP2 reduces inspector fatigue and accelerates inspection speeds, making the inspector's job more efficient while maintaining high inspection quality.

Fig. 5 - WP2 Pipeline Corrosion Mapping
See our C-Scan Inspection of pipework Utilising the WheelProbe2 (pdf, 1.2mb) application note for more information
TFM for Accurate Corrosion Profiling:
Furthermore, the Veo3's capability to utilize Total Focusing Method (TFM) ensures accurate corrosion profiling. TFM improves defect detection and characterization by providing high-resolution images with precise focusing, enabling inspectors to identify and assess corrosion with greater accuracy. In Figure 6, you can see how closely the TFM image matches the actual corrosion profile. While a linear Phased Array scan can accurately measure thickness across large areas, TFM can provide much higher resolution images of that corrosion.
")
Fig. 6 - TFM Corrosion Profile (yellow lines represent actual corrosion profile acquired via 3D scanner)
Conclusion:
Incorporating features like T-Log on the Sonatest Wave and utilizing tools like the WP2 WheelProbe with the Veo3 significantly enhances the efficiency and accuracy of pipeline corrosion mapping. Additionally, the application of advanced techniques such as TFM further improves inspection capabilities, enabling inspectors to detect and assess corrosion more effectively. By leveraging these innovations, industries can ensure the integrity and reliability of critical infrastructure while optimizing inspection plans.
Please contact our Applications Team if you have any questions. You can also find more solutions on our website.
Stay up to date with our latest content. Sign up here to get our blogs delivered straight to your inbox.
News Filter...
The latest news from Sonatest direct to your inbox.
Tags


