

High Temperature Hydrogen Attack is an issue that occurs in steel which is consistently operated at temperatures above 400˚F (204˚C) in hydrogen rich environments. Common industries encountering HTHA include Boilers, Refineries, Offshore Drilling, other petrochemical or chemical facilities, among others.
HTHA occurs when hydrogen at high temps and pressures dissolves into methane, creating micro-fissures within the steel grain structure. As the HTHA worsens and the micro-fissures turn into cracks, the mechanical characteristics of the steel are degraded and can cause complete failure of the steel component, especially when pressurisation is cyclical.
Early detection of HTHA has been an obstacle for the NDT community for years. With advances in Phased Array Ultrasonic Testing, such as TFM (Total Focusing Method) and TFMi (Intermodal TFM developed in partnership with Holloway NDT), it is possible to detect HTHA before catastrophic failure is imminent.
Technical Information & Requirements
Sonatest utilized the Veo3 PA flaw detector and X series PA probes to study the different methods used to detect HTHA. TFM and TFMi were especially helpful in detecting and sizing earlier stages of HTHA.
PA Methodology
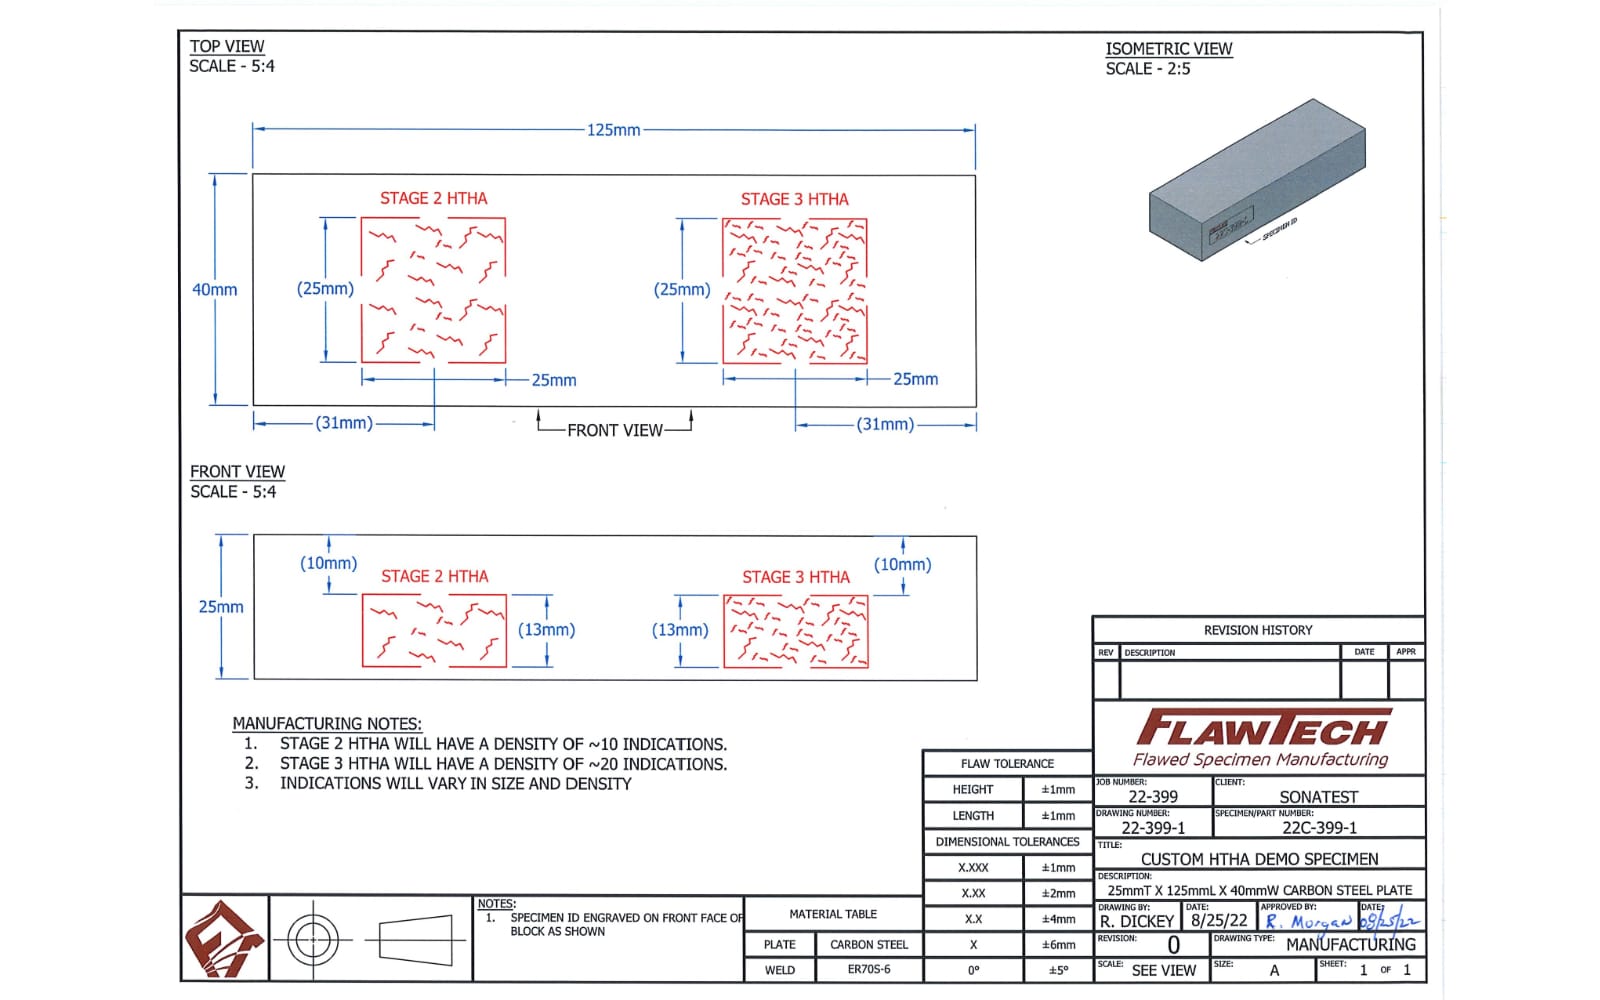
FlawTech provided Sonatest with an HTHA Demo Specimen for testing:
Equipment
| Category | Picture | Name & Description |
|---|---|---|
| Instrument | 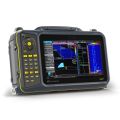 |
Veo3 32:128 Phased array device
|
| Probes |  |
|
| Software |  |
UTstudio+ was utilised in post analysis of all data acquired. |
The Inspection Results
All scans were preformed from the top side of the block, from left to right according to the drawing with Stage 2 at the beginning (left side of Top View) and Stage 3 toward the end (right side of Top View). Linear and TFM scans were performed simultaneously when both scan types were used. The “Top View” is similar to a C-Scan but uses an “extractor box” rather than a gate to extrude from a 2 dimensional area from the L-Scan to the C-Scan.
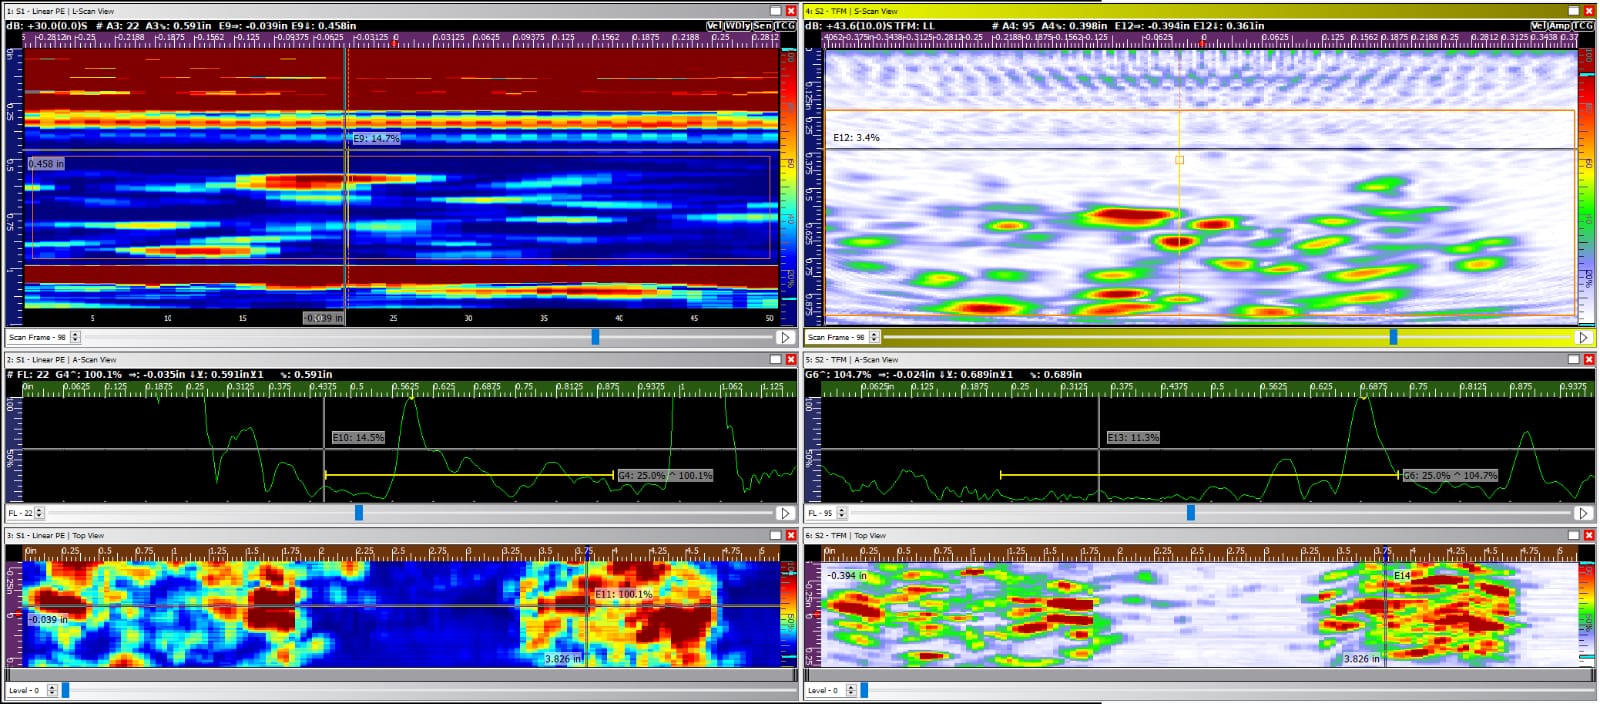
The first set of scans compare a simple Linear Scan (Left) with an 8 element aperture to a TFM scan (Right) using the LL propagation mode. Software gain and color palette parameters were altered in attempt to create the best image possible for both scan views.
 and Top View")
L Scan, TFMi Scan, Top View (similar to C Scan) and Top View
The above scans were taken using the X2A-5MHz, 16 element, 0.6mm pitch PA probe with no wedge. Flawed areas are clearly detectable with both scans, improbable to size with PA, good resolution with TFM. The small number of elements leads to a poor image quality compared to other probes.
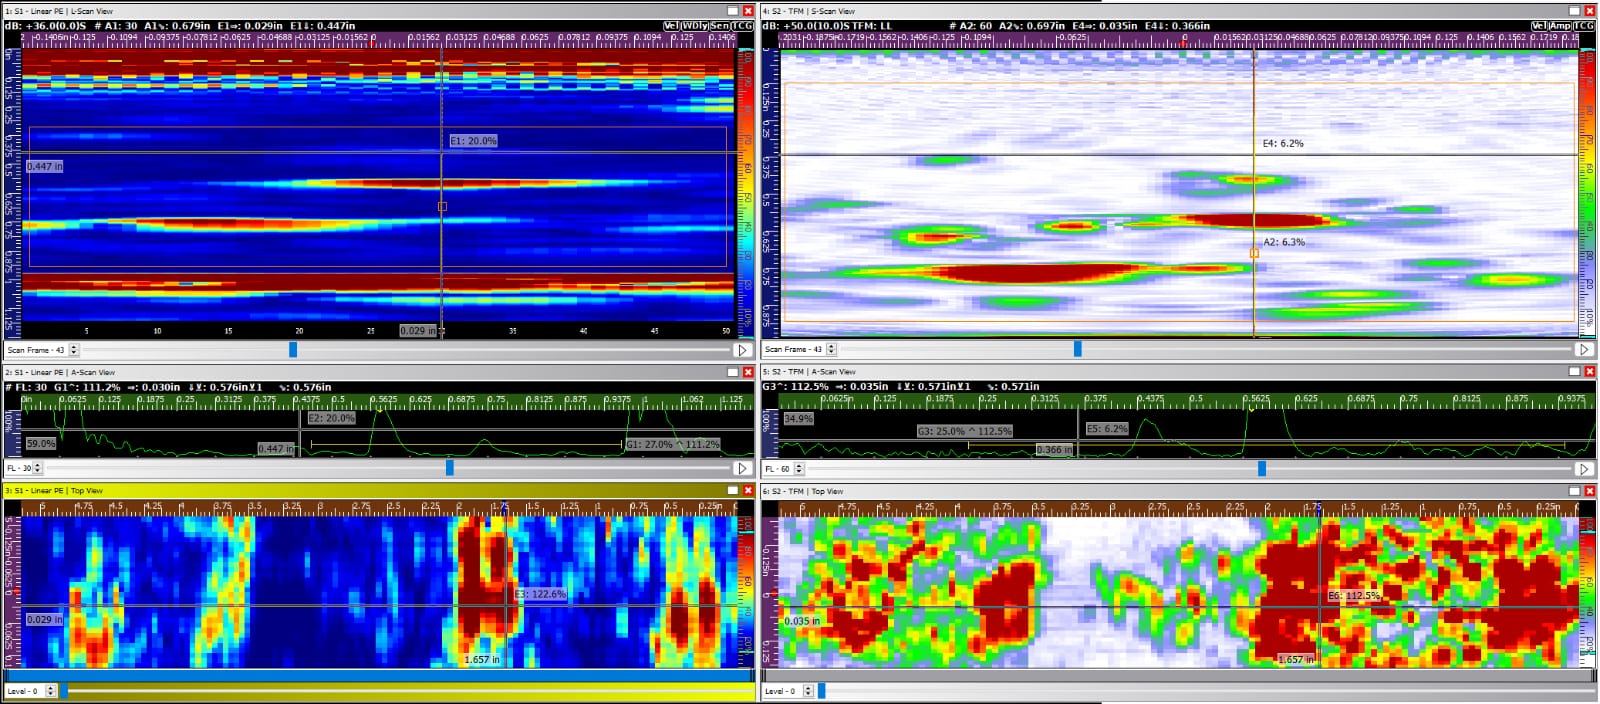
The above scans were taken using the X2A-10MHz, 32 element,0.3mm pitch with no wedge.
Improvement on Noise, Sensitivity and Resolution, with a larger number of smaller elements at a higher frequency. The inspector can easily compare the difference in quantity and size of indications between stage 2 and stage 3 HTHA. Several indications missed by the L-Scan are visible on the TFM Scan.
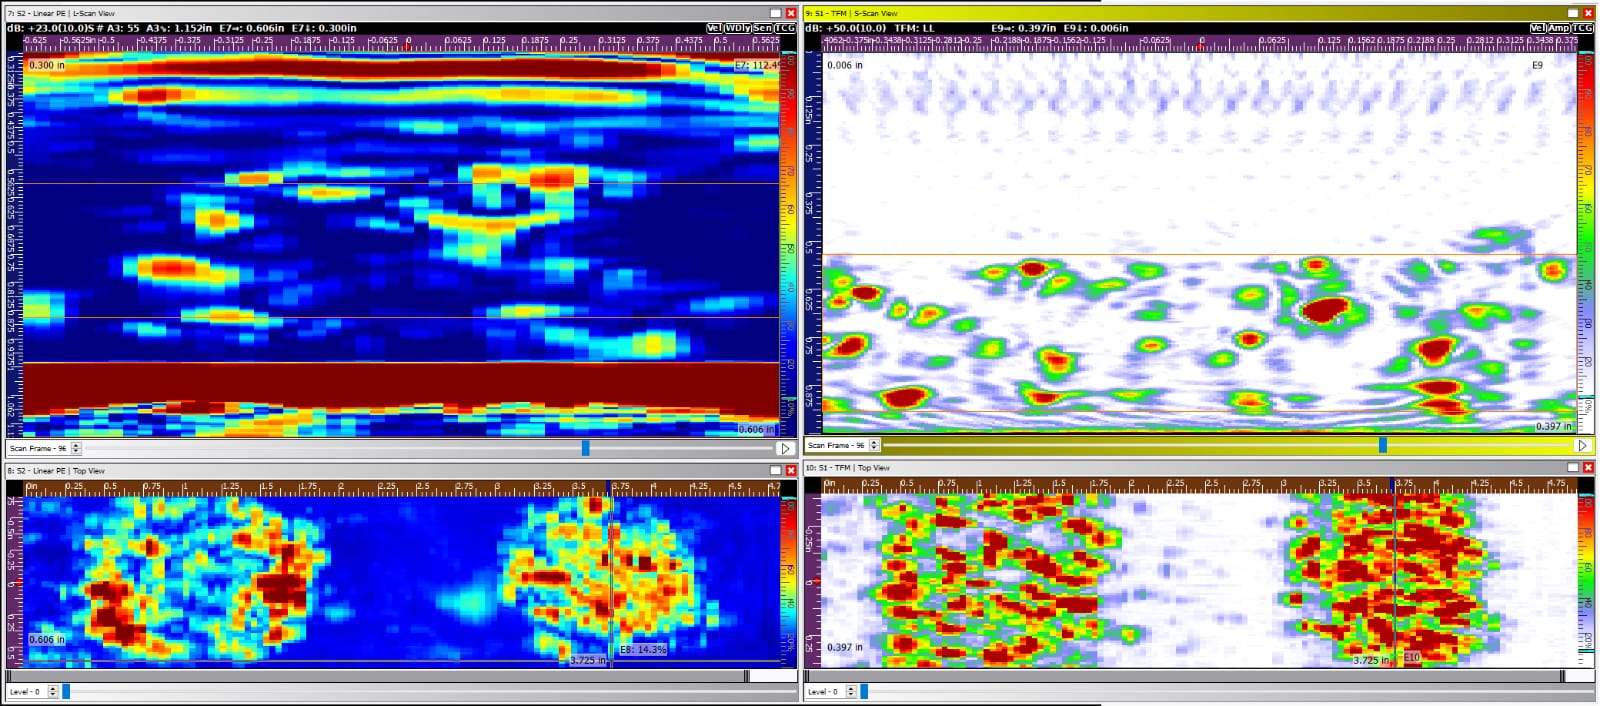
These scans were taken using the X2B-5MHz, 32 element, 0.6mm pitch PA probe with no wedge.
The L Scan has better sensitivity and resolution results. The TFM scan shows improved sensitivity and resolution as well, with a slightly les impressive SNR compared to the previous scan at a higher frequency. This size and frequency is a good compromise.
The probe with the best image was the X3A-5MHz, 64 element, 0.6mm pitch probe. This probe offered the number and pitch of elements that provided superior sensitivity and resolution, and decent SNR. The 2 stages are also easily discernable on the TFM scan.
There are a few factors to note on the above scans. First, the comparison between PA and TFM.
The flaws on the FlawTech sample are Stage 2 and 3 HTHA, meaning they are large and concentrated. This makes them easily detectable with even the simplest PA scan. The benefits of TFM are still easily visible. TFM allows for much better flaw characterization and sizing, considerably better resolution between flaws, and improved detection of smaller indications.
Secondly, probe selection can be important also. As seen above, there is subtle difference between the 5 and 10 MHz probes, but there is a large difference in sensitivity and resolution between the 16 and 64 element probes. At the large thickness inspected, the 10MHz was less useful compared to 5MHz, but with the SNR benefits, the 10MHz probes would be more suitable for thinner materials.
This is one of the many reasons TFM is the chosen method for HTHA where you need high sensitivity and resolution while maintaining a good signal to noise ratio. TFM enables the inspector to easily discern between stage 2 (left) and stage 3 (right) HTHA. The quantity, size, and amplitude of the indications are all greater on stage 3, which is to be expected.
TFM, being the chosen method, has its own characteristics that can change the efficiency of detecting HTHA. Mainly, the propagation mode will greatly affect the results. Below we will compare these modes on the HTHA sample.

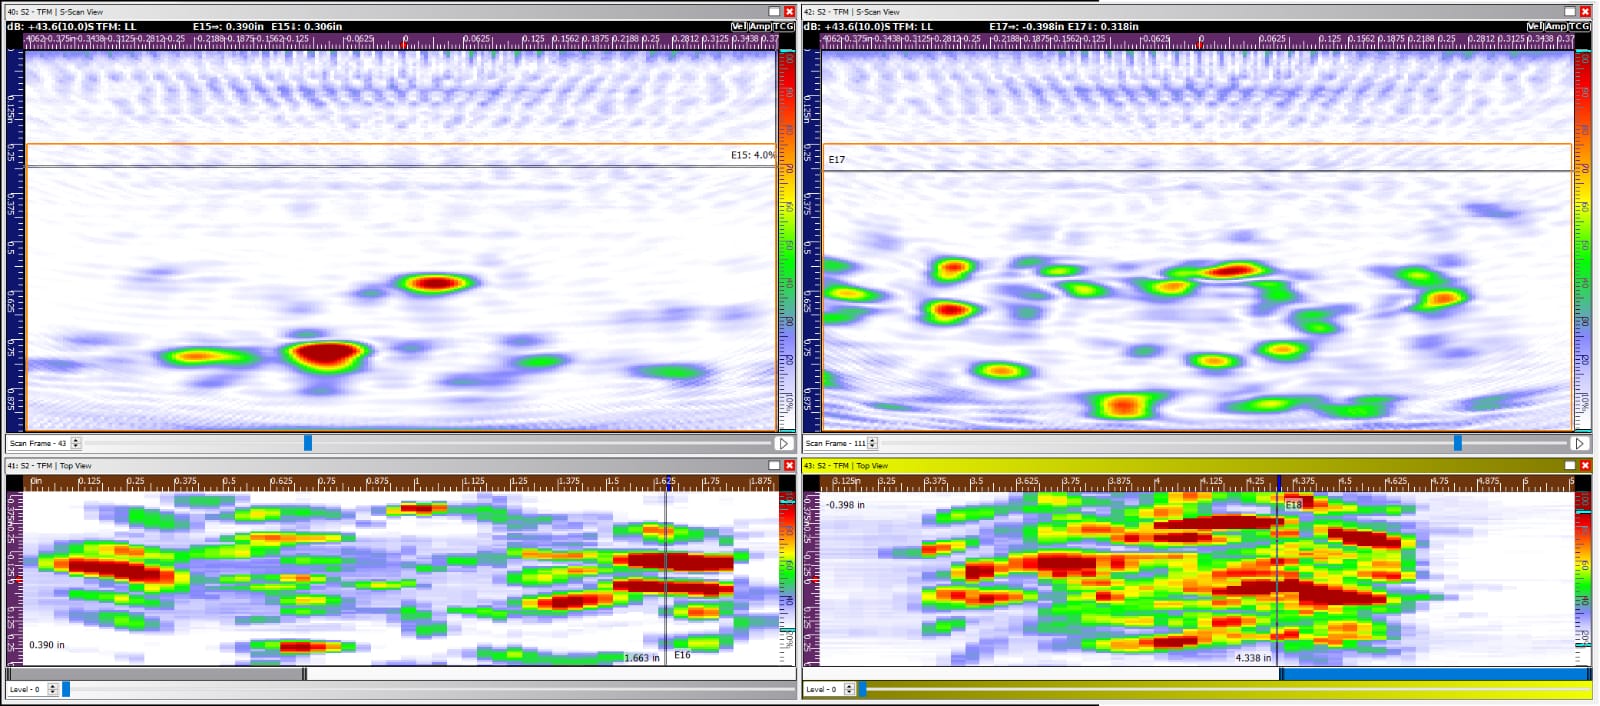
LL, LLT, LT & LLLL
Of all the available TFM propagation modes, these 4 showed the best results; LL, LLLL, LT and LLT. The indications are just too small and oriented poorly in order to get any usable reflections from the indirect modes LLL and 5L, even LLT delivers little benefits to the image while adding considerable noise. No mode showed results nearly as well as the typical LL mode. Combining these modes using TFMi can improve these images even further.

Stage 2 HTHA with TFMi
The combination of LL and LLLL using TFMi offers the best of all image quality standards; sensitivity, resolution, SNR, flaw characterization, sizing and locating, as well as the ability to resolve stage 2 vs stage 3 HTHA in the sample.

Stage 3 HTHA from the same TFMi Scan as above

Stage 2 LL, LT, LLLL

Stage 3 LL, LT, LLLL
LL, LT & LLLL TFMi modes combined also shows great results. While lacking some obvious contrasts between stages, this combination offers great sensitivity and resolution and moderately low noise. This scan would be ideal when looking to size and categorize indications within the volume of the part. On a regular and flat piece, it can be of great advantage when inspecting base materials that produce an especially noisy background, such as stainless steels or heat-treated carbon steels.
Next, we took the knowledge we gained from the FlawTech block and used them on a sample of naturally produced HTHA. This sample (provided by Team Inc.) is approximately 4” thick with HTHA present in the bottom 1”.
TFMi offered an excellent image quality, sensitivity and resolution on the HTHA sample provided. Noticing the difference between early and late stage HTHA is more apparent using the TFMi scan, comparing to the FlawTech sample as a reference guide.

This area would be considered as Stage 3 HTHA, using the FlawTech sample as a reference guide. Small, but high amplitude and concentrated indications.

Another Stage 3 example

This could be considered a Stage 2 HTHA example. Fewer indications at a lower amplitude compared to Stage 3.

This area on the authentic sample may be considered Stage 1, with very small, low amplitude reflections. With proper calibration and reference levels, the inspector could use TFMi to locate HTHA in this stage, before the damage becomes catastrophic.

Merged C scan of an area approximately 9” x 7”
Lastly, an image including a Merged C scan of an area approximately 9” x 7”. This real HTHA coupon shows growing inclusions from the inside diameter of the steel part. A higher frequency probe is recommended because it offers a higher far surface resolution so any suspicious porosities could be detected near the powerful back wall echo.
There are many options available to you when testing for HTHA. Some setups will have better characteristics than others, with most having associated drawbacks. There will usually be a compromise. TFM will usually offer better sensitivity and resolution compared to a Linear Array, but will require more power and slower scanning speeds. TFM also necessitates the selection of a single propagation mode, which can be difficult to determine what the best option is if the flaw is unknown. TFMi, while still requiring more processing power and times, can offer excellent benefits above standard TFM and PA, especially when the part geometry allows for more than the direct LL propagation mode. Utilizing the Veo3, TFMi, and one of the various PA probes offered, you can find an excellent solution for HTHA inspections.
Please contact our Sales Team if you have any questions. You can also find more solutions on our website.
Stay up to date with our latest content. Sign up here to get our blogs delivered straight to your inbox.
News Filter...
The latest news from Sonatest direct to your inbox.
Tags


