When Total Focusing Method (TFM) technologies arrived on the portable instrument market, the recording-speed performance was problematic. With time, significant improvements have been made to improve this limitation.
However, despite investments and improvements, this technique still is significantly slower compared to the phased-array approach. Bottlenecks, as explained in Identifying the Recording Speed Limitations of Your Ultrasonic Instrument, remain the same. The algorithm that reconstructs the TFM image is quite demanding for the processing power of the instrument and integrating this technology in a portable instrument is quite challenging. Fortunately, these bottlenecks can be mitigated by proper optimisation of TFM inspection configurations.
Optimise Your TFM Scan Resolution
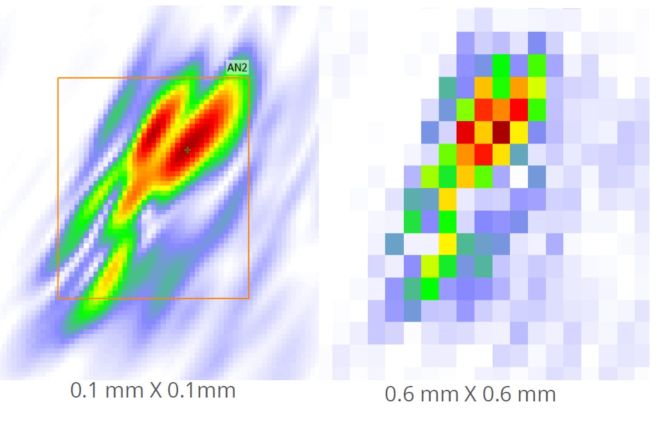
The resolution parameters of a TFM scan define the amount of pixels per the dimension of the reconstructed image. Resolution is one of the main parameters for the TFM technique: it has a major impact on both recording speed and TFM image quality. In the TFM algorithm, every computed pixel display in the image must be processed. The higher the resolution setting is, the more pixels that must be processed, which directly affects speed performance. However, the resolution needs to be high enough so that the inspection remains compliant with industry standards.
The ASME committee addresses this parameter as an essential criterion: the standard states that the TFM image’s resolution needs to ensure an amplitude fidelity of 2dB or less of the pre-processed ultrasonic information. The Sonatest Amplitude Fidelity NEW calibration wizard ensures that your inspection configurations are always compliant. In fact, it has never been this easy and safe to optimize your configurations.

Figure 1: The Amplitude Fidelity wizard ensures that you inspection setup is optimised and compliant.
The Size of Your Zone of Interest
In addition, the bigger your zone of interest (ZOI), the more TFM pixels that are required, which again impacts the speed performance. A best practice recommendation stipulates that when the defect position is predictive, the TFM ZOI shall be optimised on the defect to detect/size. The rest of the volume could be covered with standard phased-array. Combining both techniques definitely improves speed performance. Note, however, that the phased-array technique has been proven to generate a better probability of detection. It also has more energy penetration power compared with TFM. On the other hand, TFM has a higher resolution and better sizing capabilities. Figure 2 shows how the TFM could be used to increase resolution and sizing on areas where Lack of Fusion and cracks are more susceptible to appear — all while covering the rest of the weld volume with the phased-array technique. Combining speed performance and resolution in one single scan is your best option!
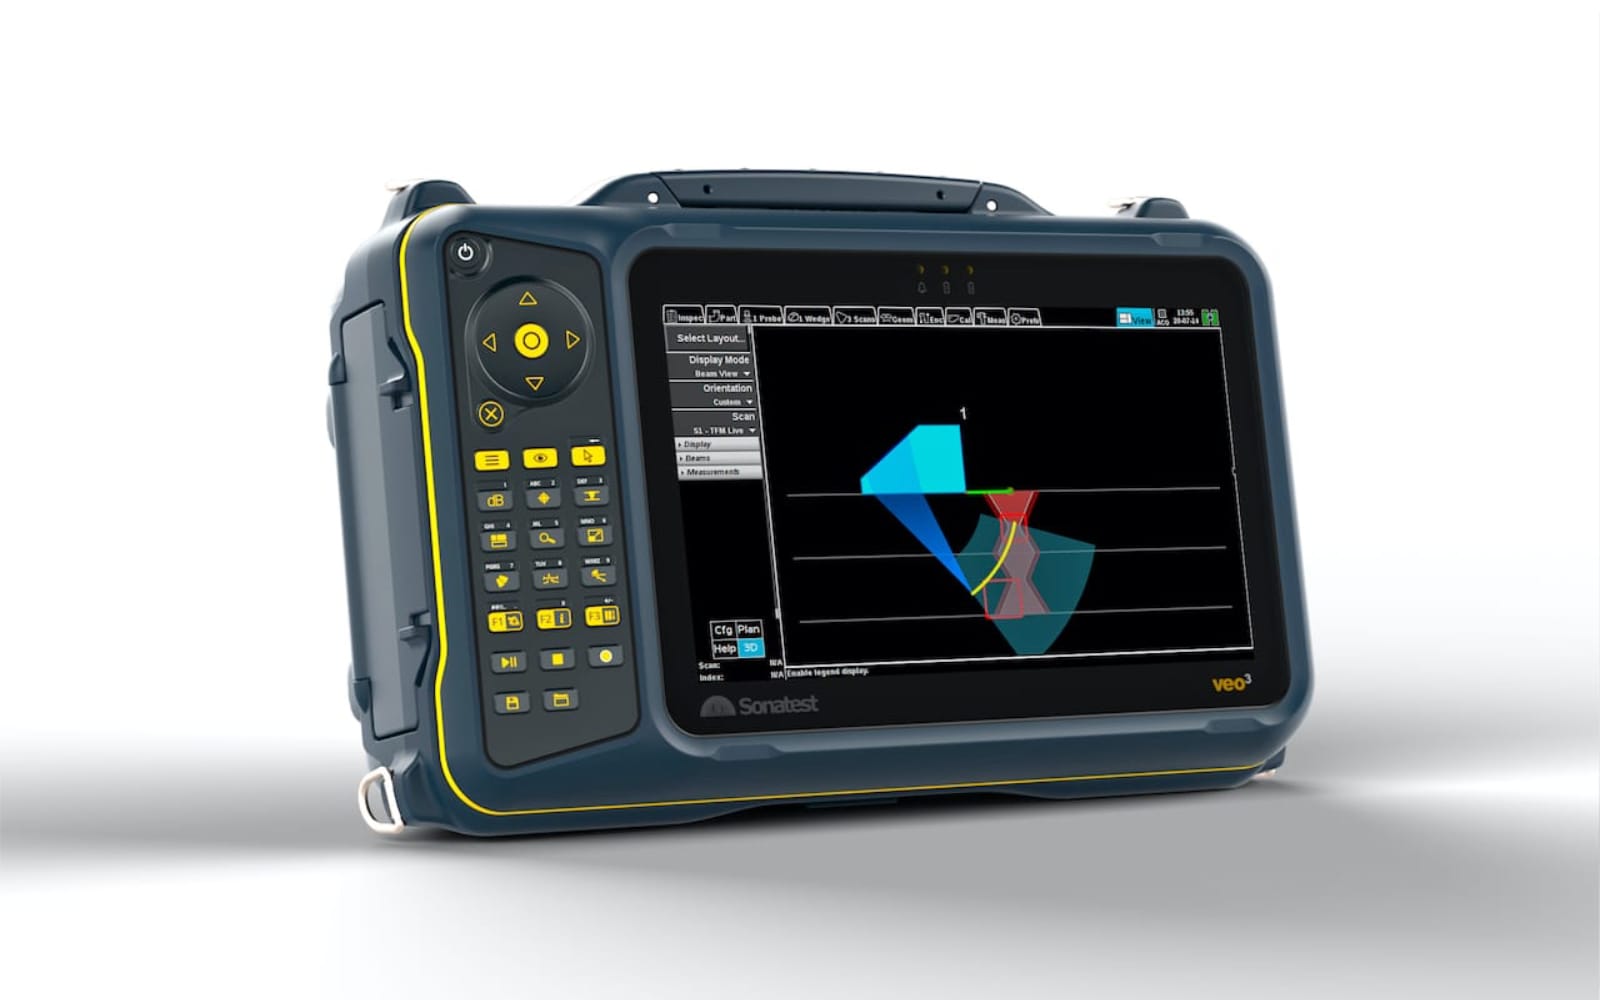
Figure 2: An embedded scan plan in the veo3 that uses TFM for Lack of Fusion and surface cracks detection
Optimise Algorithm Image Processing
Another way of optimising the speed performance of the configuration is to reduce the overall number of A-scans processed by the TFM algorithm. Those who are familiar with the technique know that the TFM image is a reconstruction from a matrix filled with multiple A-scans generated by individual elements of a phased-array device. What most people do not know is that not all A-scans have a meaningful contribution in most TFM image reconstructions. As displayed in Figure 3, elements far from the emitting element in some circumstances would have no or very little energy response information. These A-scans are processed anyway by the electronic device and inevitably slow down the algorithm performance.
E-5 E0 E+5
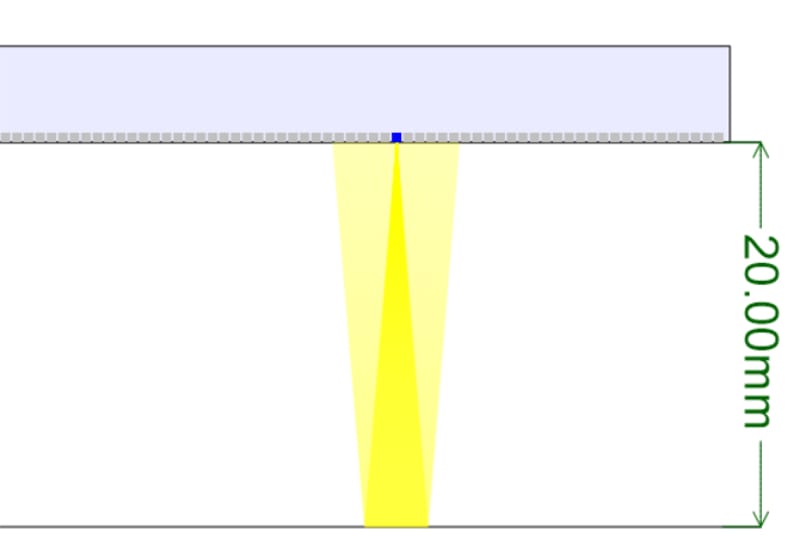
Figure 3: Beam diffraction generated by one element on a 64-element probe during an FMC acquisition
Sonatest’s veo3 offers the capability to tailor the A-scan algorithm contribution with a parameter called Sparse Matrix Capture (SMC). This parameter can significantly improve the speed performance all while decreasing the Signal to Noise Ratio (SNR) of the TFM image. Figure 4 shows an example of a configuration on a side drill hole and the effect on performance and SNR (Same acquisition, TTTT mode).
| FPS: 16Hz | FPS: 22Hz | FPS: 27Hz |
| SNR: 19dB | SNR: 17dB | SNR: 12dB |
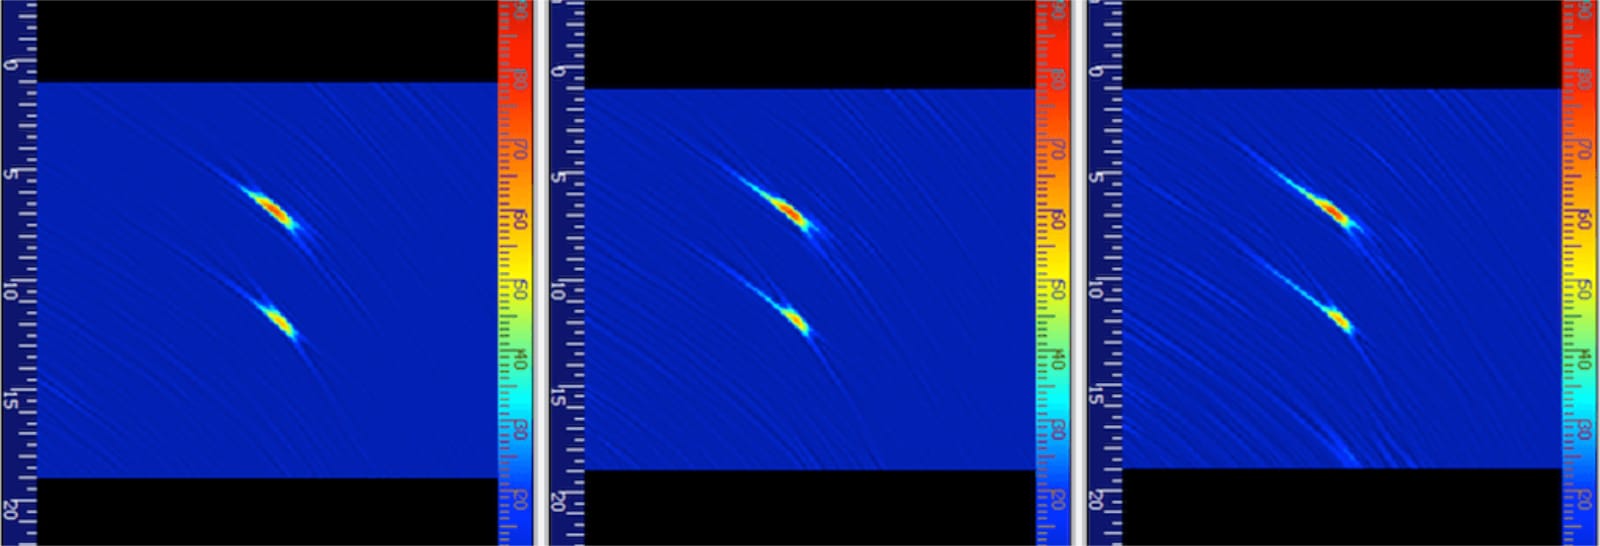
Figure 4: The SMC parameter’s effect on the performance and SNR (For The same acquisition, TTTT mode))
Conclusion
The veo3’s electronic unit and software is powered by a customized Linux OS. The solution has a unique architecture that offers superior data throughput and unsurpassed computational capacity to deliver fast and accurate results in the most demanding conditions. This unsurpassed capability, combined with an audacious software implementation, ensures that the veo3 meets all your daily inspection challenges in terms of resolution and speed performance.
Please contact our Applications Team if you have any questions. You can also find more solutions on our website.
To follow further content and our newsletter, please contact us and check “Add to mailing list”.
News Filter...
The latest news from Sonatest direct to your inbox.
Tags
Related Products
