

Many studies recently and accurately claim that using TFM strategies for weld inspections is reliable regarding sizing precision and detection rate.
However, the conclusions suggest that post-analysis tools should be better structured to improve their precision and accuracy. This is why this blog highlights common mistakes and proposes a few solutions to address them.
Quick Review of our TFMi & PAUT analysis
Our 2024 study [1] has been comparing TFMi™ with established techniques, such as Sectorial Scans (S-scans), Total Focusing Method (TFM), and Time of Flight Diffraction (TOFD), measuring metrics like flaw detection rates, precision, and characterization. Sonatest used weld samples with known defects, such as cracks, porosity, and slag inclusions, which were analyzed independently by experts, ensuring unbiased results with minimal human influence.
The study revealed TFMi™’s superiority in imaging clarity and its ability to identify subtle flaws like cracks and porosity that other techniques often miss. While S-scans demonstrated general reliability, they struggled with low-amplitude flaws such as porosities. TOFD provided correct depth data, but inspectors lacked precision at embedded indications (and chose the wrong positive & negative phase analysis). TFM/TFMi™’s approaches produced higher detection rates for complex flaw geometries, such as root and centerline cracks, surpassing traditional methods in specific scenarios. These advantages are especially valuable in automotive ultrasonic testing where weld integrity and component reliability are critical for safety and production quality.
General Mistakes
In the referred papers, there are a few universal inspection details that require extra attention. The following table lists some that should require your attention.
| Key Situations & Consequences | Good Practice & Insights |
|---|---|
|
TFM - Poorly positioned ROI & probe offset inaccuracies 
|
Check for wider TFM ROI, if the scanner moves, the weld volume will remain covered |
|
TFM: Check your resolution is correct, fine enough for good defect detection but low enough for a good scanning rate. This will allow for better resolution and better sizing. |
Fine resolution (one fifth of probe wavelength) helps to obtain a better precision during the post-analysis step. This level of precision is increasingly important in automotive ultrasonic testing environments where high-throughput inspections demand both speed and accuracy. |
|
PA-TFM: Ensure you explore the full defect length for the extremities of the bottom and top heights, these will not always be in the same frame and can cause under sizing. Here is a root crack example: 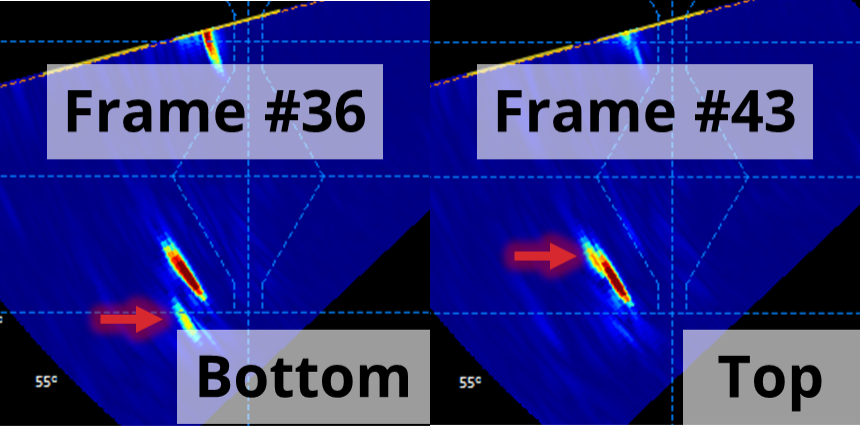
|
Check the frame playback around the indication. |
Specific Weld Scenarios
Some defects can be misleading from a PA S-scan to TFM. In most cases below, doing a second and optimised NDT test is recommended when there is a significant indication.
| Key Situations & Consequences | Good Practice & Insights |
|---|---|
|
Low Amplitude Indication for situations, such as porosities and shallow slag inclusion. |
+14 dB quick review is a good habit 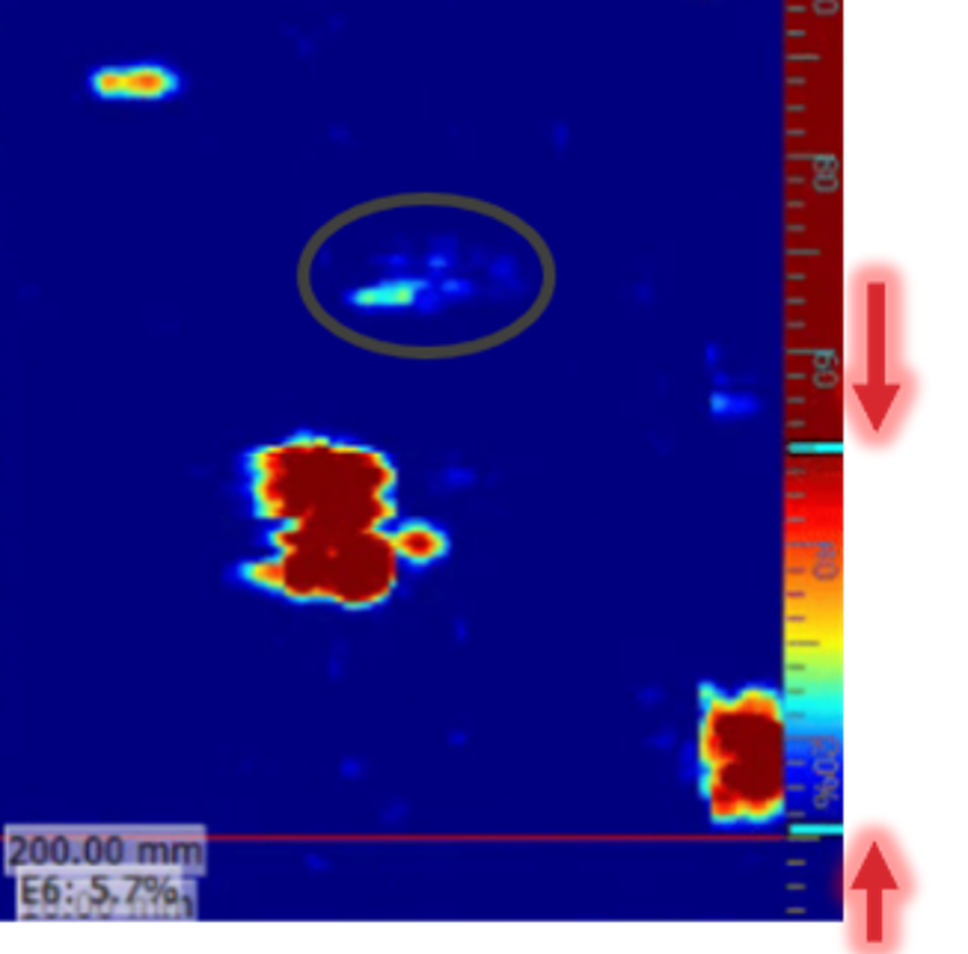
|
|
Mischaracterization of a centerline crack in the middle of a double Vee welds |
The lack of fusion in the center would not move a lot along the depth axis. The crack propagation can move up and down. |
|
Side wall crack vs. lack of side wall fusion 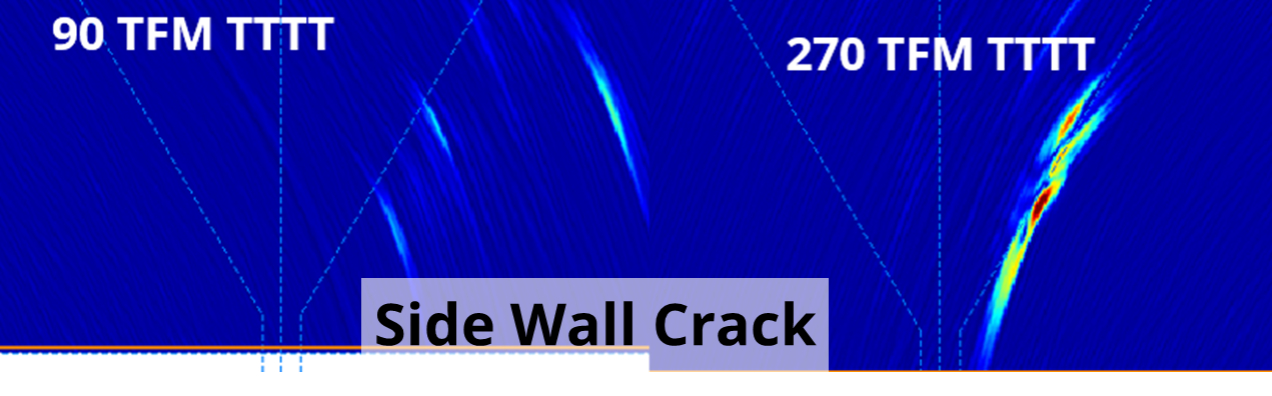
|
Double check the playback signal, there might be diffracted tips on the edges. |
|
Root crack: S-scan data versus TFM data TFM can be misleading because the root crack top tip appears in the same ROI position as the bottom tip if you use 2 separate TT and TTTT groups. Keep max TFMi does not add insightful information |
Do not split TFM TT and TTTT groups and use a deeper TT ROI to add the TTTT in the same image. 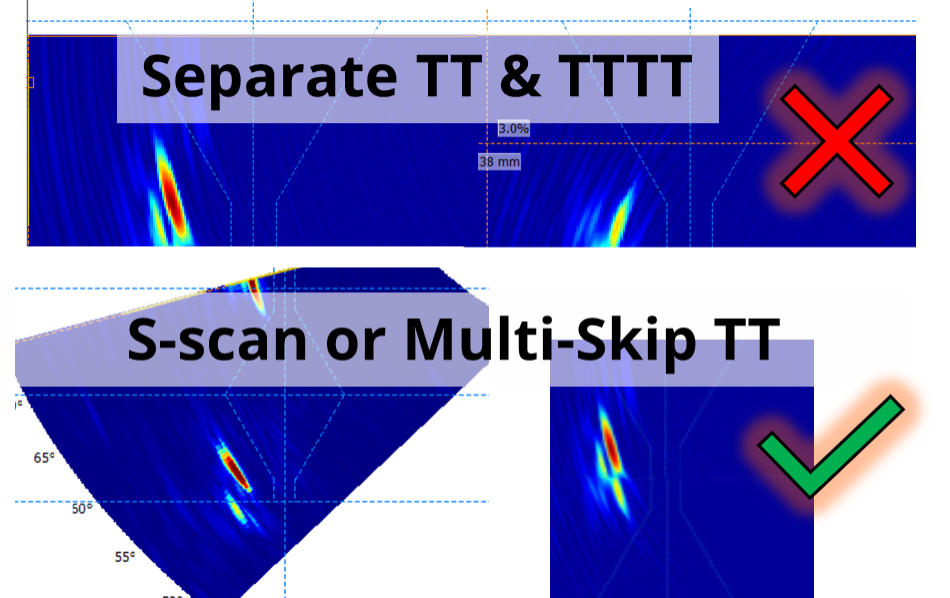
|
|
TOFD lack of side wall fusion, inner slag and centerline crack |
Extra care at interpretation and extra ultrasound check should be done such as an S-scan from both sides of the weld. |
|
The side slag (on the right) indication shows no tails on the bottom, the hyperbolic cursors could have been misplaced. 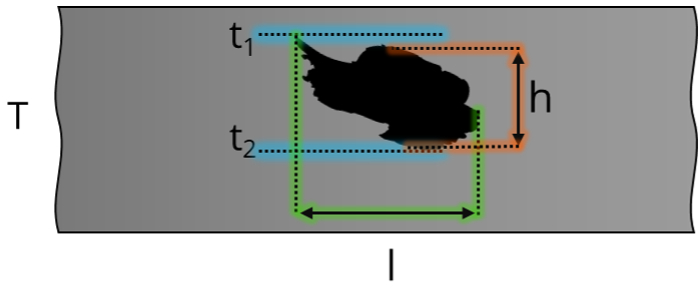
T: Thickness |
Extra care for non-hyperbolic TOFD B-scan signal response. 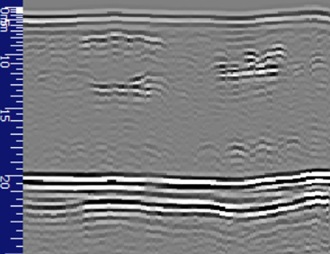
|
Conclusion
Ultimately, TFM and TFMi alone demonstrated promising results in reducing error rates and improving flaw characterization. Although the recent studies are still proving that inspectors must be extra careful with details during the inspection. Enhanced training and automation can further mitigate human errors, ensuring even more consistent and precise weld evaluations. The blog still reveals many negative points about the PA-UT techniques, but we have more tools today to reach the “perfect” performance. Again, Sonatest has a role to point out those critical points regarding imaging inspection.
And remember:
Please contact our Applications Team if you have any questions. You can also find more solutions on our website.
Stay up to date with our latest content. Sign up here to get our blogs delivered straight to your inbox.
[1] P. Rioux, W. Haworth, S. Hughes. Intermodal Total Focusing Method (TFMiTM) and Multi-technique Ultrasonic Sizing Analysis Study. Sonatest AP; Québec, Canada https://sonatest.com/application/files/5716/9537/8242/Intermodal_TFM_with_Applications_to_Weld_Inspections.pdf
[2] BS EN ISO 15626:2018, Non-destructive testing of welds – Time-of-flight diffraction technique (TOFD) – Acceptance levels, Section 6.3.3: Details the methodology for assessing flaw height through the evaluation of diffracted signal timing from flaw tips, critical for meeting specified acceptance levels.
News Filter...
The latest news from Sonatest direct to your inbox.
Tags