UTmap is analysis software that creates a Tiled Scan (T-Scan) using multiple individual C-Scans and generates combined images of the inspection results.
Each C-Scan can be positioned or stitched together to form a T-Scan and represent the part’s geometry. Once assembled, the T-Scan represents a full image of the inspection area for analysis and reporting.
Improved Analysis Software
The T-scan provides an interactive C-scan canvas where users have the flexibility to manipulate cursors, data, and annotations as desired. With high-resolution pixel mapping of amplitude and depth modes, defects can be precisely identified and annotated with complete scan definition. Since the introduction of UTmap in 2018, we have enhanced various analysis scenarios to further enhance the precision of the T-scan data.
Key Tools, Benefits and Analysis Scenarios
For each scenario below, we have identified a key feature in UTmap that shows benefits it brings to the reviewer. We will also add any important comments that may help your analysis process.
Scenario 1 - Automatically generate measurements from detected defects.
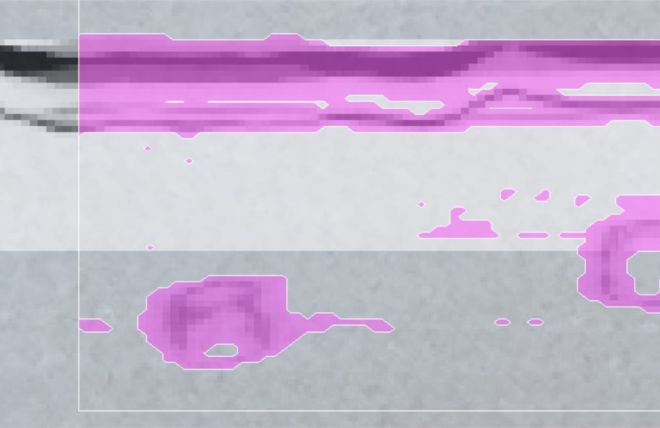
Using the UT Map Annotation boxes, when activated the annotation box dynamically adjusts its contours, highlighting defect areas in a highly contrasted colour. It willindicate the presence of a defect that exceeds predefined limits in thickness or amplitude modes. Users can select either amplitude criteria, depth criteria, or both simultaneously.

Defect colour has been customised to pink
Scenario 2 - Individual C-Scans may have differing gain settings due to poor coupling or surface conditions. This can produce visible differences in the T-Scan images produced.
Using the post-acquisition gain adjustment feature, you can balance the gain setting and gate positions across all C-Scans to produce a unified T-Scan image. This allows for consistency in defect evaluations across all scans.

Unique scanning gain per C-scan
Scenario 3 - Mistakes in C-Scan alignment, scan orientation and start positions can cause an incorrect overall combined image.
UTMap allows for full control of the scan orientation and direction, enabling adjustments to be made when combining the final scan.

C-scan canvas for a perfect position
The data crop feature removes missed data and overshoots on scans, preventing the annotations from gathering low-quality data.
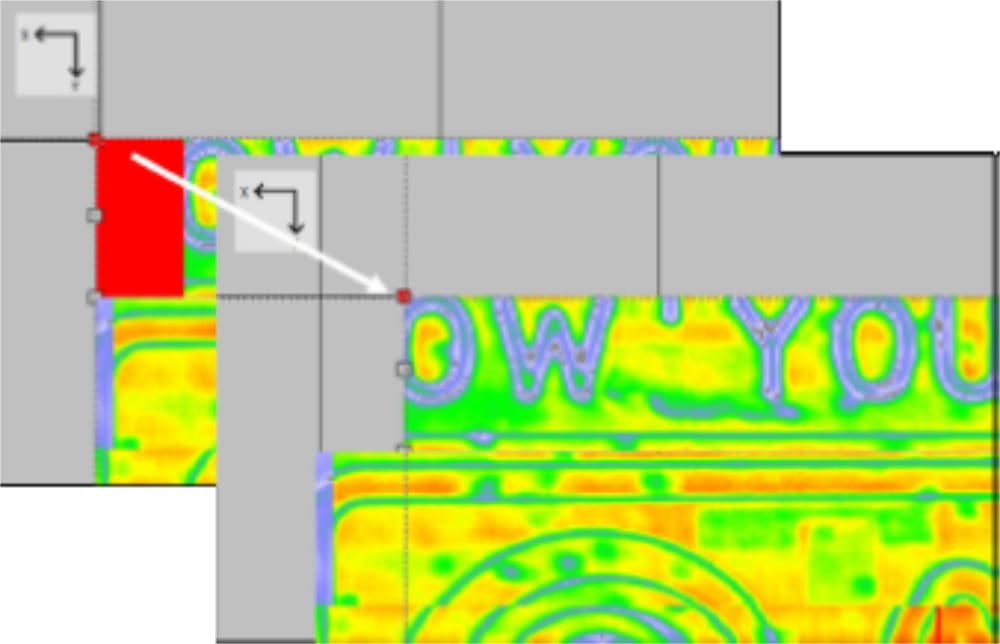
C-scan cropping
Scenario 4 - When corrosion mapping, datum evaluation precision is critical. When the cursor’s position over an inspected area is critical for defect evaluation, you can achieve perfect assessment measurement. The next two tools remove human error during data interactions.
Both annotation cursors and C-scans can have preset positions for repeatable positioning over multiple inspections.
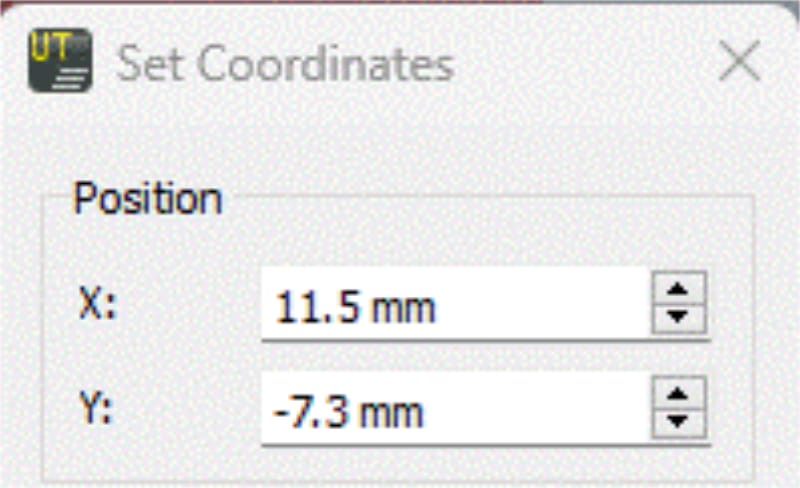
Set Coordinates box
Users may prefer to snap the annotation cursor exactly to the C-scan’s edges.
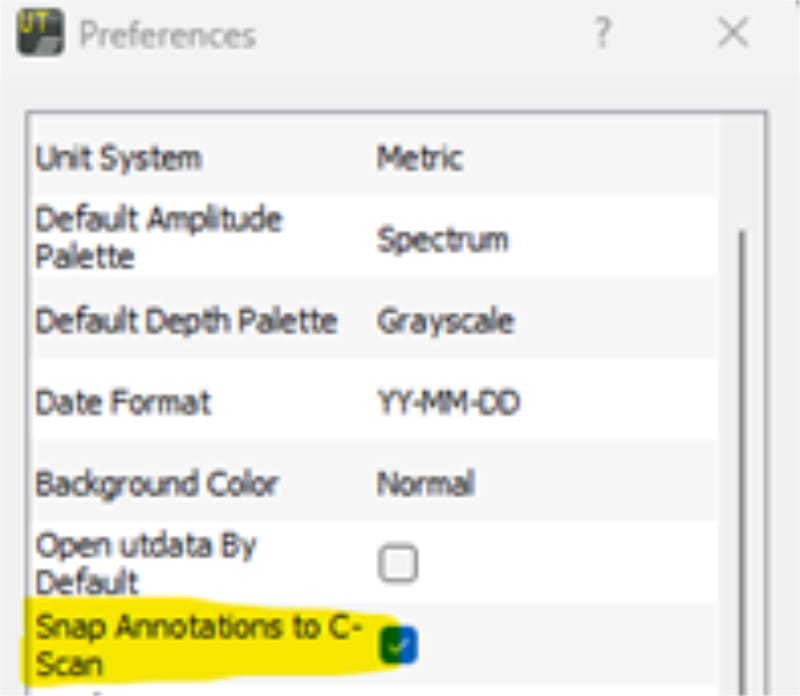
Snap Annotations enabled in Preferences
This article has provided valuable insights and enhanced your understanding of UTmap analysis. Should you have any further inquiries or require assistance with UTmap utilization, please do not hesitate to contact us. Our team is available to address any questions or requests you have.
Please contact our Applications Team if you have any questions. You can also find more solutions on our website.
To follow further content and our newsletter, please contact us and check “Add to mailing list”.
News Filter...
The latest news from Sonatest direct to your inbox.
Tags