- Blog
Success Story: Avoiding an Unplanned Downtime Thanks to Ultrasonic Phased-Array Thickness Mapping

17th February 2021
Marc-Antoine Blanchet, V-P Sales & Marketing, TORNGATS Technical Services

Stating that unplanned downtime is costly is a truth that resonates across almost any industry, but that is especially true in the oil and gas sector.
For example, refinery operators can lose as much as 1.5M$/day when shutting down process critical equipment due to a leak or a failure. The incentive for mechanical reliability is a strong one!
Corrosion remains one of the most prevalent damage mechanisms and refinery operators are leveraging ultrasonic thickness measurement as part of their strategy to evaluate the integrity of their assets. Of course, ultrasonic testing (UT) is just one piece of the puzzle, but it plays a key role as illustrated in this brief success story.
This is how the true story got started. As an ultrasonic technician was going through the various thickness monitoring location (TML) ports on an insulated tower, he came across a thin reading. However, moving the transducer ½” up and then ½” down, the value was drastically different. Facing uncertainty and unable to interpret with confidence the indication, the asset owner called on TORNGATS Technical Services to further investigate using ultrasonic phased array testing.
For sure, the small port size was making it hard for the UT technician to interpret the indication and determine if it was delamination, a blister, an inclusion or severe corrosion.
If that was going to be severe corrosion, the call had to be made with absolute certainty due to the critical decision that would follow. Indeed, the material loss was nearly 50% wall thickness.
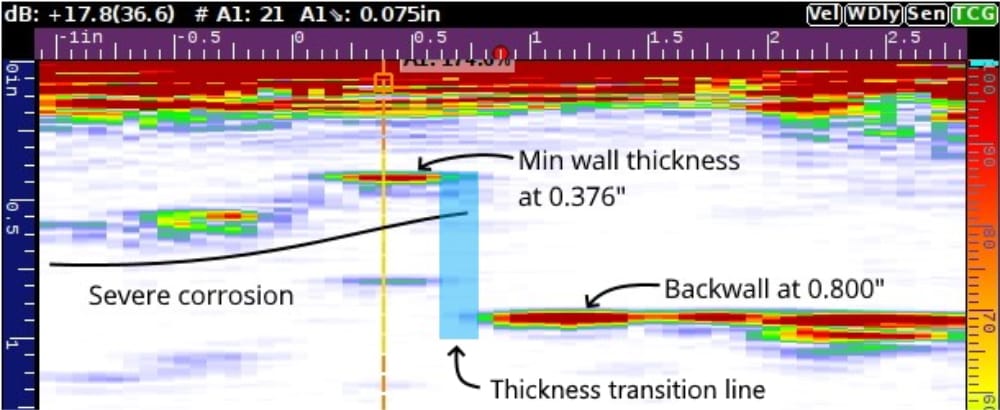
Sure enough, as the phased array transducer hit the 325ºF hot steel, the verdict was brought down. Severe corrosion at a tray ring transition had taken place in the tower. That was bad news! Therefore, more and more insulation got removed until the problematic area was fully circumscribed. The initial inspection port was right at a transition point, making the reading difficult. As illustrated below, with no imaging capability and limited scanning space, data interpretation was truly challenging using only conventional UT.
Using the Sonatest VEO along with a 64 elements transducer hooked to a QuickTrace encoder, the full area got mapped out, pass-by-pass.
Over the years, TORNGATS has developed a unique recipe when it comes to corrosion mapping. It starts from a systematic grid mapping and data collection approach, up to the optimized data post-processing stage.
At the post-processing stage, TORNGATS has a three-step process involving first, the identification of minimum and maximum thickness values using UTStudio, second, the data extraction as .csv files and third, the importation of data into our Stathick software. Stathick was developed by TORNGATS in response to our customer needs. It uses the lower and upper limits previously found and automatically processes all of the data, generating statistical analysis along with a final report.
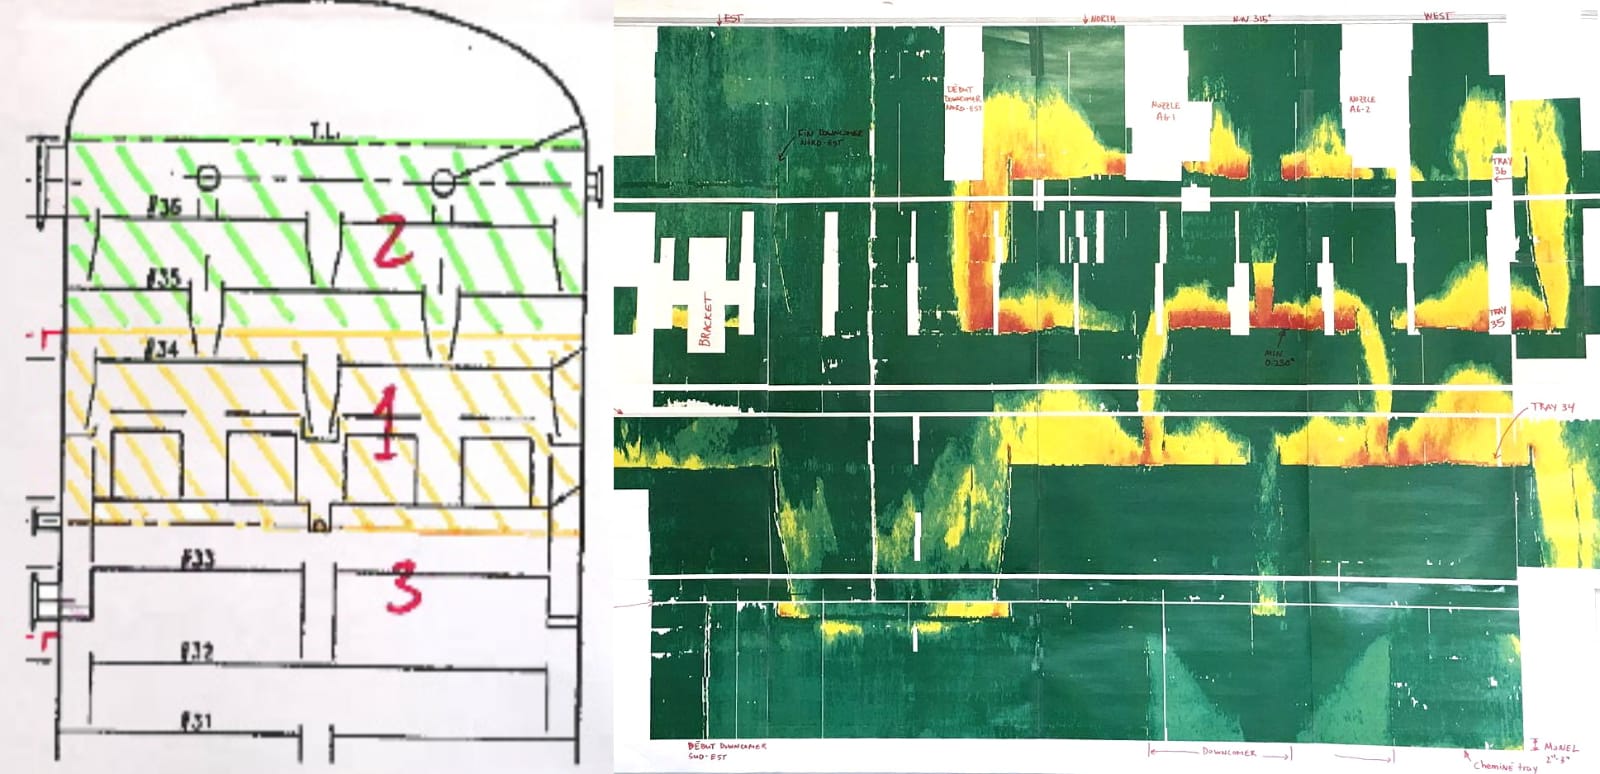
The efficient execution of this turn-key procedure led to the creation of a giant map showing, in a crystal clear fashion, the corrosion damage. For those familiar with pressure tower, they will recognize the flow of fluid coming down along the trays/downcomers. Because the corrosion was localized, it would have been easy to dismiss the initial finding. Thankfully, further investigation occurred leading to the discovery of the issue. In the subsequent months, the tower was regularly scanned to monitor its condition until the planned shutdown, which enabled its safe replacement with no loss of production.
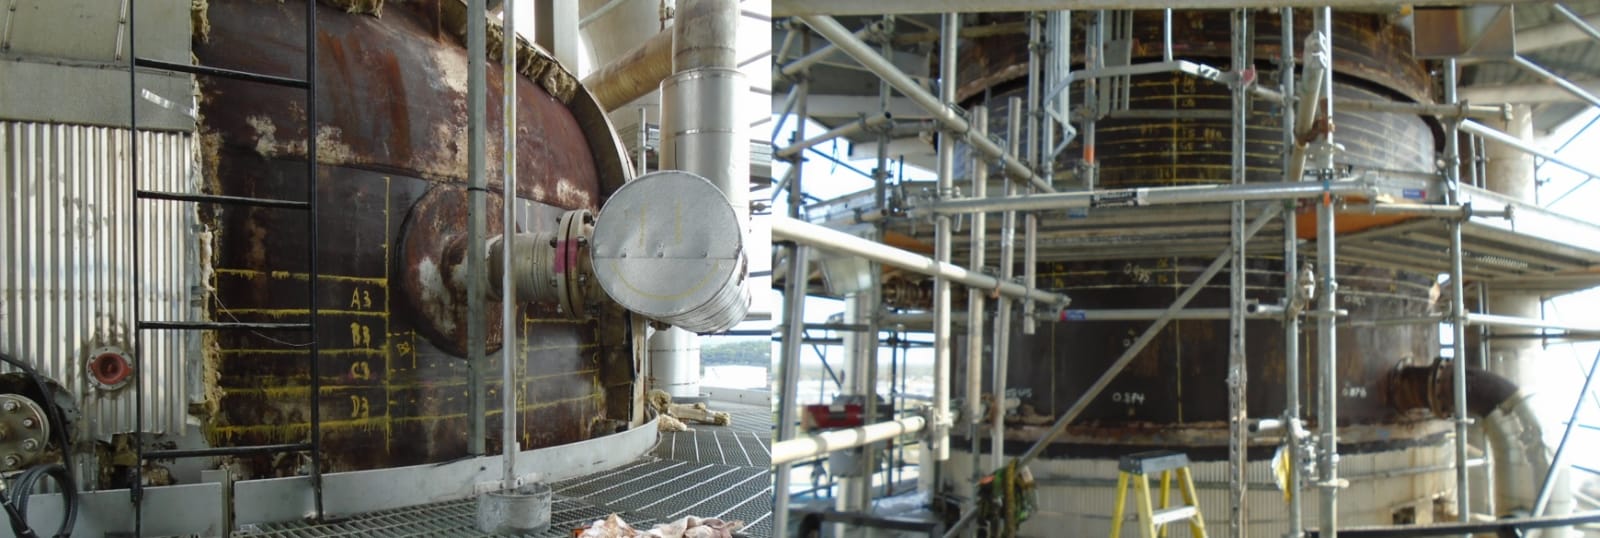
The success of this mapping laid in the ability to leverage the power of straight beam phased array imaging, combined with a repeatable and reliable process that can be applied in the field despite obstacles and constraints. As illustrated in some of the pictures below, brackets, supports, ladders and nozzles were obstructing the way. That was no easy task to collect high-quality data on a hot surface across all those obstacles. Nonetheless, all the individual zones were merged to obtain the map illustrated previously. Blank areas are representing obstacles where no data could be encoded, those spots were manually scanned.
This brief success story illustrates the benefits of leveraging inspection and maintenance plans but also lays down the business case for wider adoption of straight beam ultrasonic phased array mapping. As the reliability manager on-site said, “preventing this near-miss justifies the adoption of phased-array for the next 10 years to come”.
Would like to learn how to deploy this approach? Please do not hesitate to contact us at info@torngats.ca
A few statistics about this story:
- Equipment used – Sonatest VEO with UTStudio
- 730 ft² covered
- 41 passes of 628" long by 4" wide
- Completed in approximately 7 days
- 3 technicians and 1 data analyst
- Customer satisfaction: 100%
Please contact our Applications Team if you have any questions. You can also find more solutions on our website.
Stay up to date with our latest content. Sign up here to get our blogs delivered straight to your inbox.
News Filter...

The latest news from Sonatest direct to your inbox.
Tags