
Mapping and Viewing Tools
In this document, we will provide details on our embedded software and PC tools that allow efficient ways to analyse any kind of mapping data (corrosion, composite, castings etc).
Gate Extraction
Our corrosion mapping data includes a complete uncompressed A-scan set. Analysing this data can become tedious when the A-scan signal constantly fluctuates over the encoded position. Fortunately, the gate item provides an option for the user to choose whether the scan represents absolute gate measurements or calculates the difference between two gates. For a depth C-scan like Figure 1, it is preferable to display the variation between two gates, rather than the absolute position of a gate.
 in a volumetric sketch")
Figure 1 2D views (A, L, C, B) in a volumetric sketch
Gate-to-Gate Result
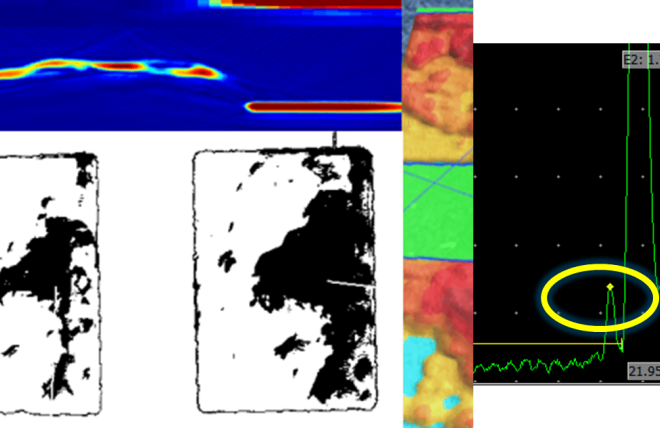
Gate 1 (red) and G2 (orange) cover the interface and back wall echo (BWE) regions, respectively. The C-scan (Figure 3) result is next to the gate position in Figure 2

Figure 2: Gate-to-Gate Extraction

Figure 3: Depth C-scan based on Figure 2
Smarter Gate-to-Gate Option
When detecting indications solely based on the BWE, the "Gate Follow" option becomes very valuable. Instead of having a gate relative to the interface, the gate's starting position is controlled by the BWE peak position. This enables corrosion spots to appear, regardless of the nominal thickness of the part. The main objective is to prioritise small reflections above the large back wall, ensuring that the data does not exclusively include BWE information.

Figure 4: Corrosion attack with standard gate position

Figure 5: Corrosion attack with standard gate position
Figure 2 shows the red gate picking up the back wall echo just like if it was in an early stage of corrosion.
The red gate in Figure 5 has cleared the orange backwall position, so it only picks up the early corrosion spot.
The next 15-second figure's animation also shows the red gate's no follow/follow behaviour. Using the Gate Follow feature, the red gate can immediately be positioned by the BWE echo signal, allowing its C-scan extraction to contain this tiny edge detection. Otherwise, the red gate is fixed, and the user has to manually move it until the tiny peak is evaluated.

Figure 6 Gate Follow Behaviour that is enabled and disabled. Watching the entire GIF takes 15 seconds.
We can also note that the Figure 5 setup provides good edge contouring because it is sensitive to those peaks by the back wall.

Figure 7 The left C-scan has fixed gate position and the right C-scan has a dynamic gate extraction against back the back wall position
Since its launch date, all the aforementioned view and cursor features have been accessible for TFM and TFMiTM scans. We have even incorporated the extraction box to ensure that TFM scans have accurate end and top views. The TFM data set is similar to a 0-degree linear scan, which is why the extraction box slicing feature also functions similarly as shown in the video link.
The extraction box does not necessarily merge all pixels, as shown in Figure 8. Its size determines the region of interest for the scrolling top and to end view. For TFM LL mapping setups, gate-to-gate options are available, but the interface gate correction is not feasible.

Figure 8: TFMi Top end view behaviour
Conclusion
Both the TFM and the L-Scan use excellent analysis tools, including smart gate-to-gate features and the extraction box. The Gate Follow feature can save analysis time and misleading gate mapping extractions. Our team is eager to offer additional analysis tips to enhance your assessment methodology.
Please contact our Applications Team if you have any questions. You can also find more solutions on our website.
Stay up to date with our latest content. Sign up here to get our blogs delivered straight to your inbox.
News Filter...
The latest news from Sonatest direct to your inbox.
Tags